Yesterday I coded a simple web page to do position size calculations. Before anything else, margin trading is VERY risky, I’m not a financial advisor. However, I wanna share my setup and how I come to it. I talk a lot with my brother Ginda on trading, I introduced him to cryptocurrency and he introduced me to trading Bitcoin.
Position Size Calculator
The website I built is positioncalculator.com. It’s 30 minutes work but it’s already helping size up my positions. I built this with inspiration from Jacob Canfield’s video in Youtube. Before using this, whenever I’m planning an entry, I calculated everything manually.
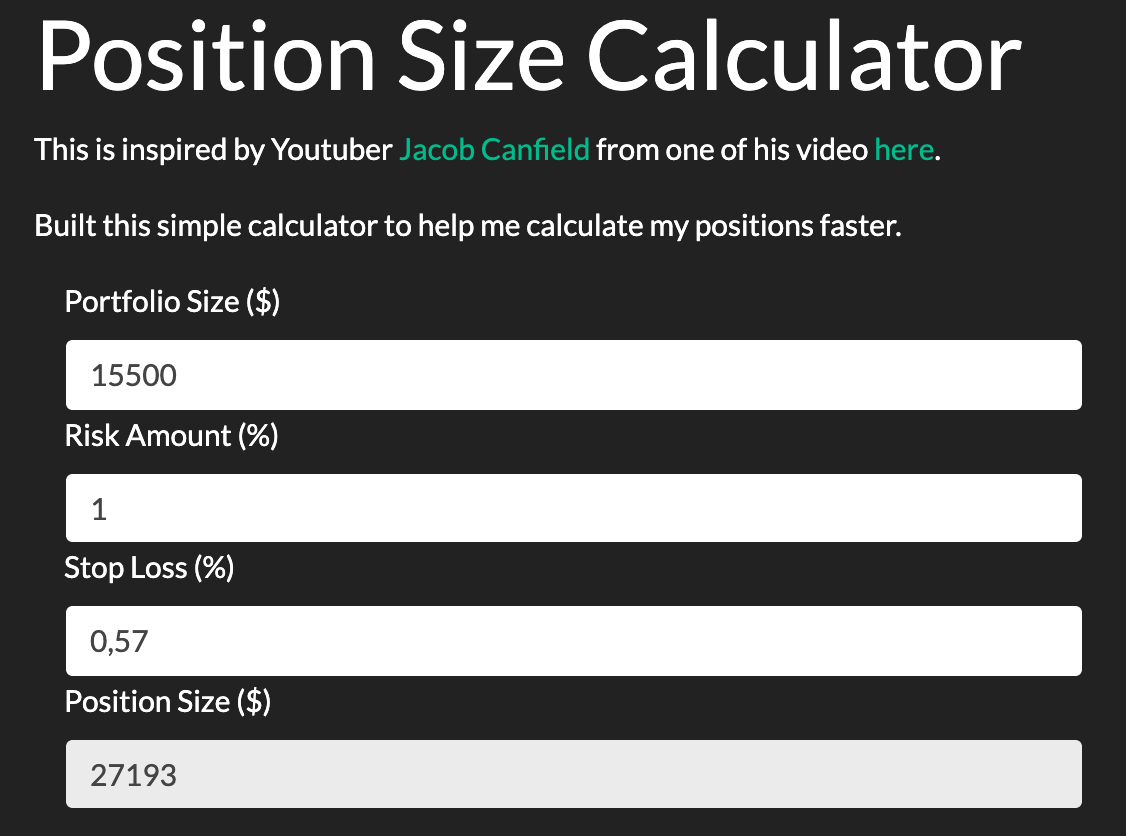
You should watch the video above to get an understanding of how the calculator works. What I like about it is zero fuss, I focus on charting and when there’s an entry opportunity I know how much of the position is safe within my risk profile. Then I can choose whatever leverage I want as long as it’s higher/lower than your liquidation price depending if you’re long or short.
Charts and Indicators
The absolute standard is TradingView. Nothing else comes close to it. I only chart from Coinbase, all other seems to mirror Coinbase (wash trade, especially when volumes are low). Index prices are all Coinbase dominant anyways.
Timeframes
The timeframe I usually use is 13 minutes. My trades have been most successful when I use this timeframe. I can spot trends faster and yet the candles are not as random as 1 or 5 minutes. Further more, I have more candles to look at in 1 hour than the conventional 15 minutes.
One other thing that is interesting, whenever a 13 minute candle is closing (usually in the last minute), the price usually gets pressured where the trend is heading.
Indicators
My TradingView subscriptions limits me with 5 indicators. Had a massive discount from them. Was on a monthly plan and when I reached 6 months, they gave me 50% off for the 6 months, was more than happy to pay up.
Before talking more about indicators, I wanna talk about Bill Williams. His book Trading Chaos brought order to my head. Here’s a bite size PDF explaining his whole book, if you like the PDF, buy the book! There’s a whole lot more in the book than the PDF. A one liner to recap what I learned from the book would be: In chaos, look for structures instead of patterns. I had to unlearn what I knew.
The book is like when software engineers first read Uncle Bob’s Clean Code. For me it’s like when I first learned how to code functional reactive programming. Why didn’t I learn about it sooner? This is the question I learned these new concepts.
Fractals
There are no fractals if you look at the screenshots above. I don’t need the indicators, it’s not hard to identify fractals. Fractals are the building block of structures, they show you hard fought battles between buyers and sellers. Me and my brother always say it’s more action watching a pump or dump than watching action movies.
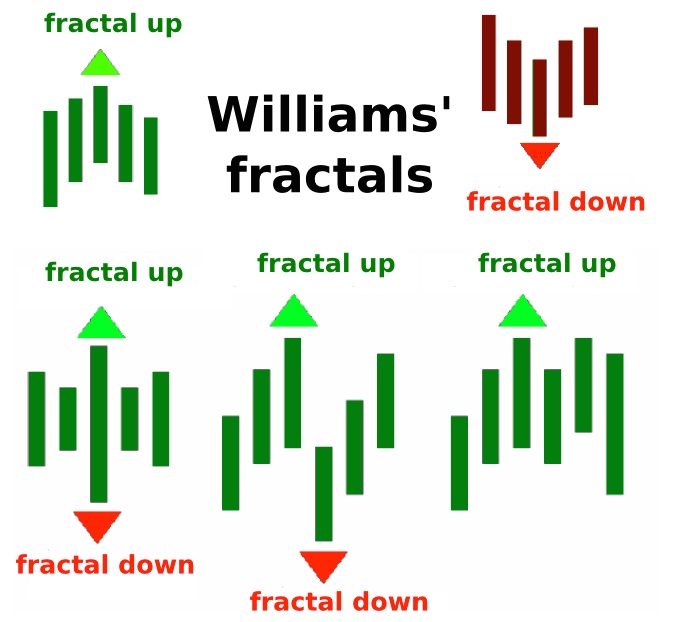

Both of the images are fractals. The fingers in your hand are fractals. The bend in rivers are fractals. The way an island or a continent borders with the sea are fractals. I won’t steal your thunder, you need to read Trading Chaos to experience your aha moment yourself.
Doji candles are your friend, they show you reversals and or when a trend is exhausted. As what Carl from The Moon Youtube Channel always say: The trend is your friend.
Volume Indicators
I use 3 volume indicators:
- Volume Weighted Moving Average (VWMA) with 21 as its length
- Volume Weighted Average Price (VWAP)
- Volume Profile Visible Range (VPVR)
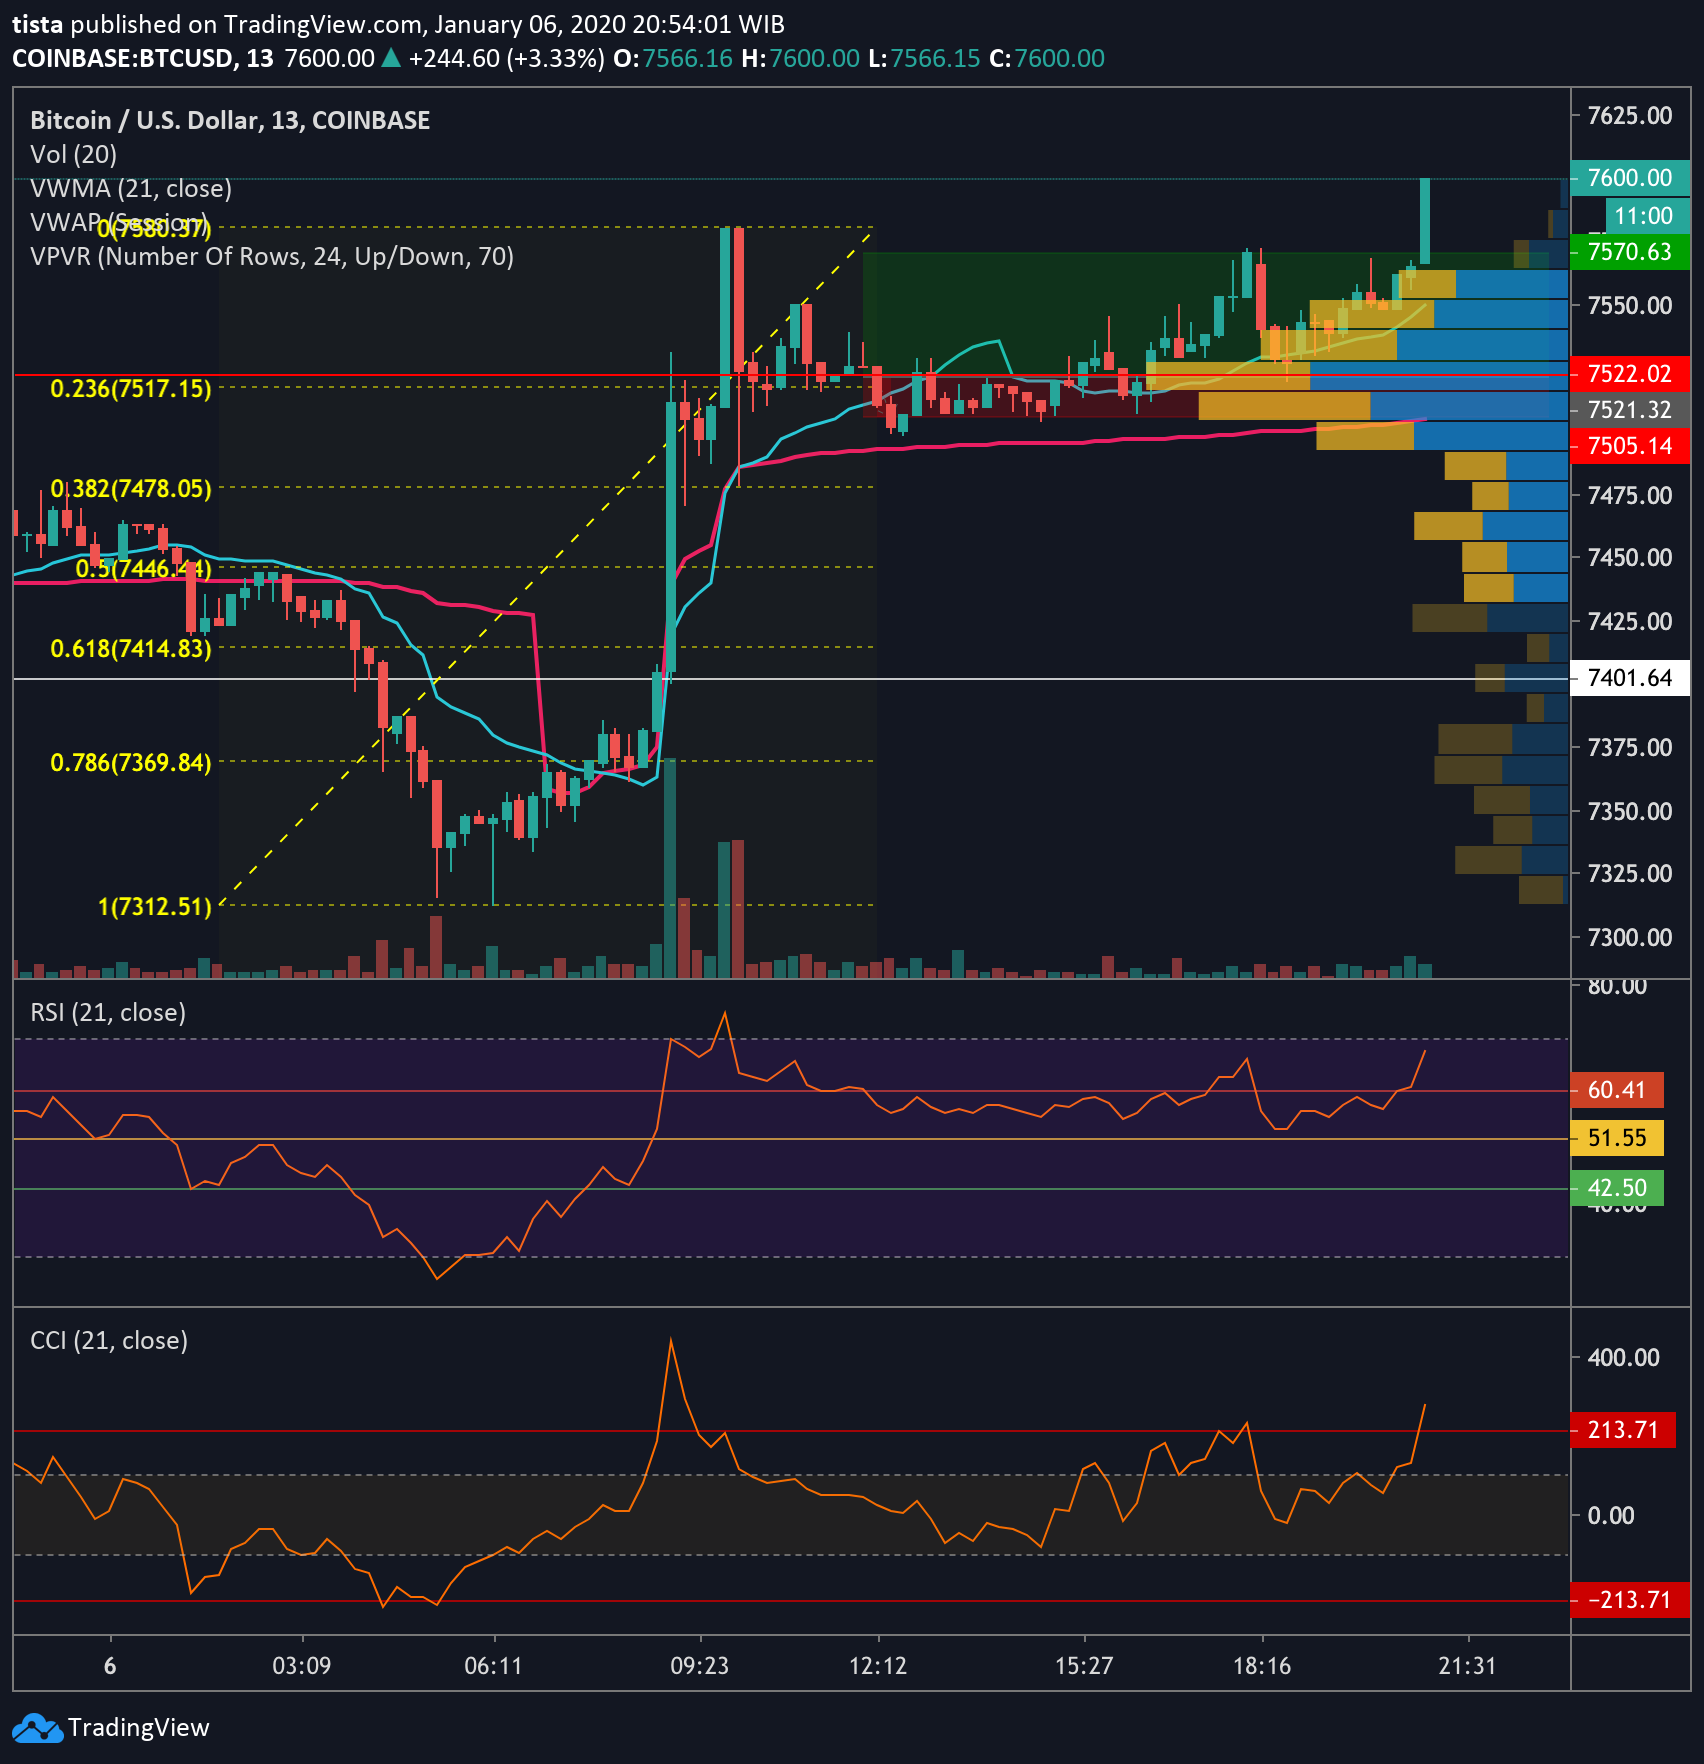
Volume is key! It shows how loud price movements are. Both these indicators gives me a bottom and upper range either as a support or resistant. Here’s what I mean.
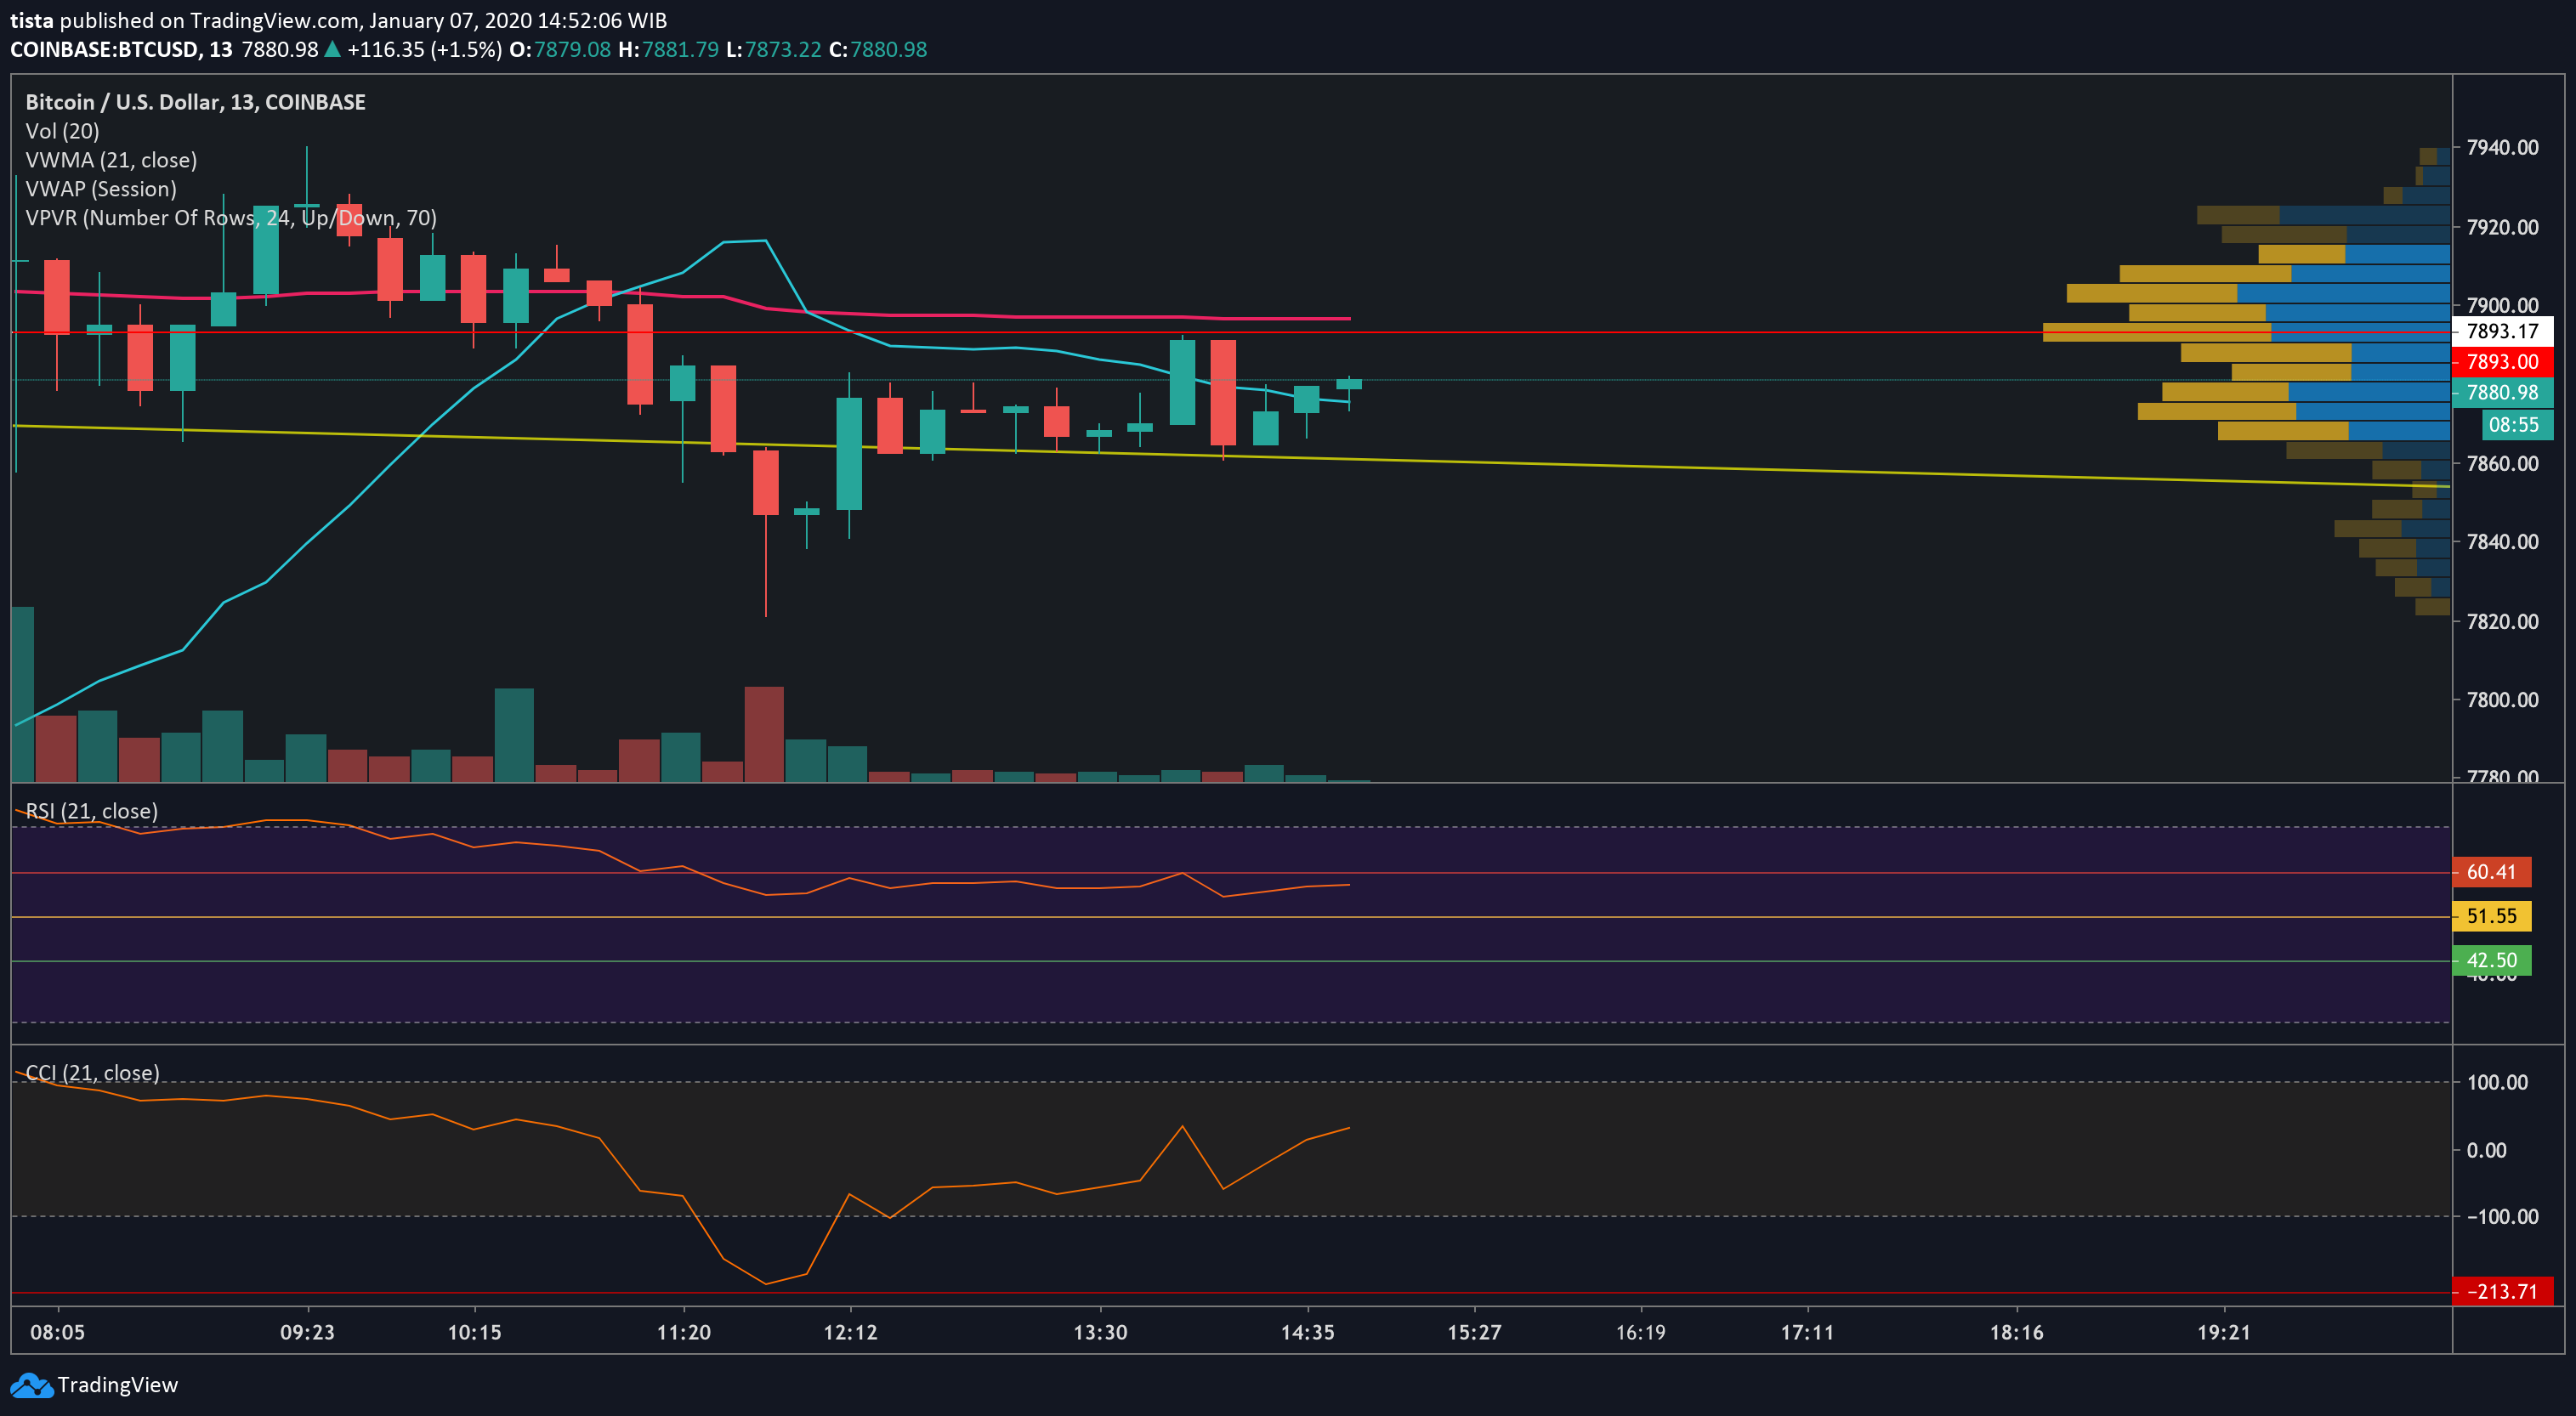
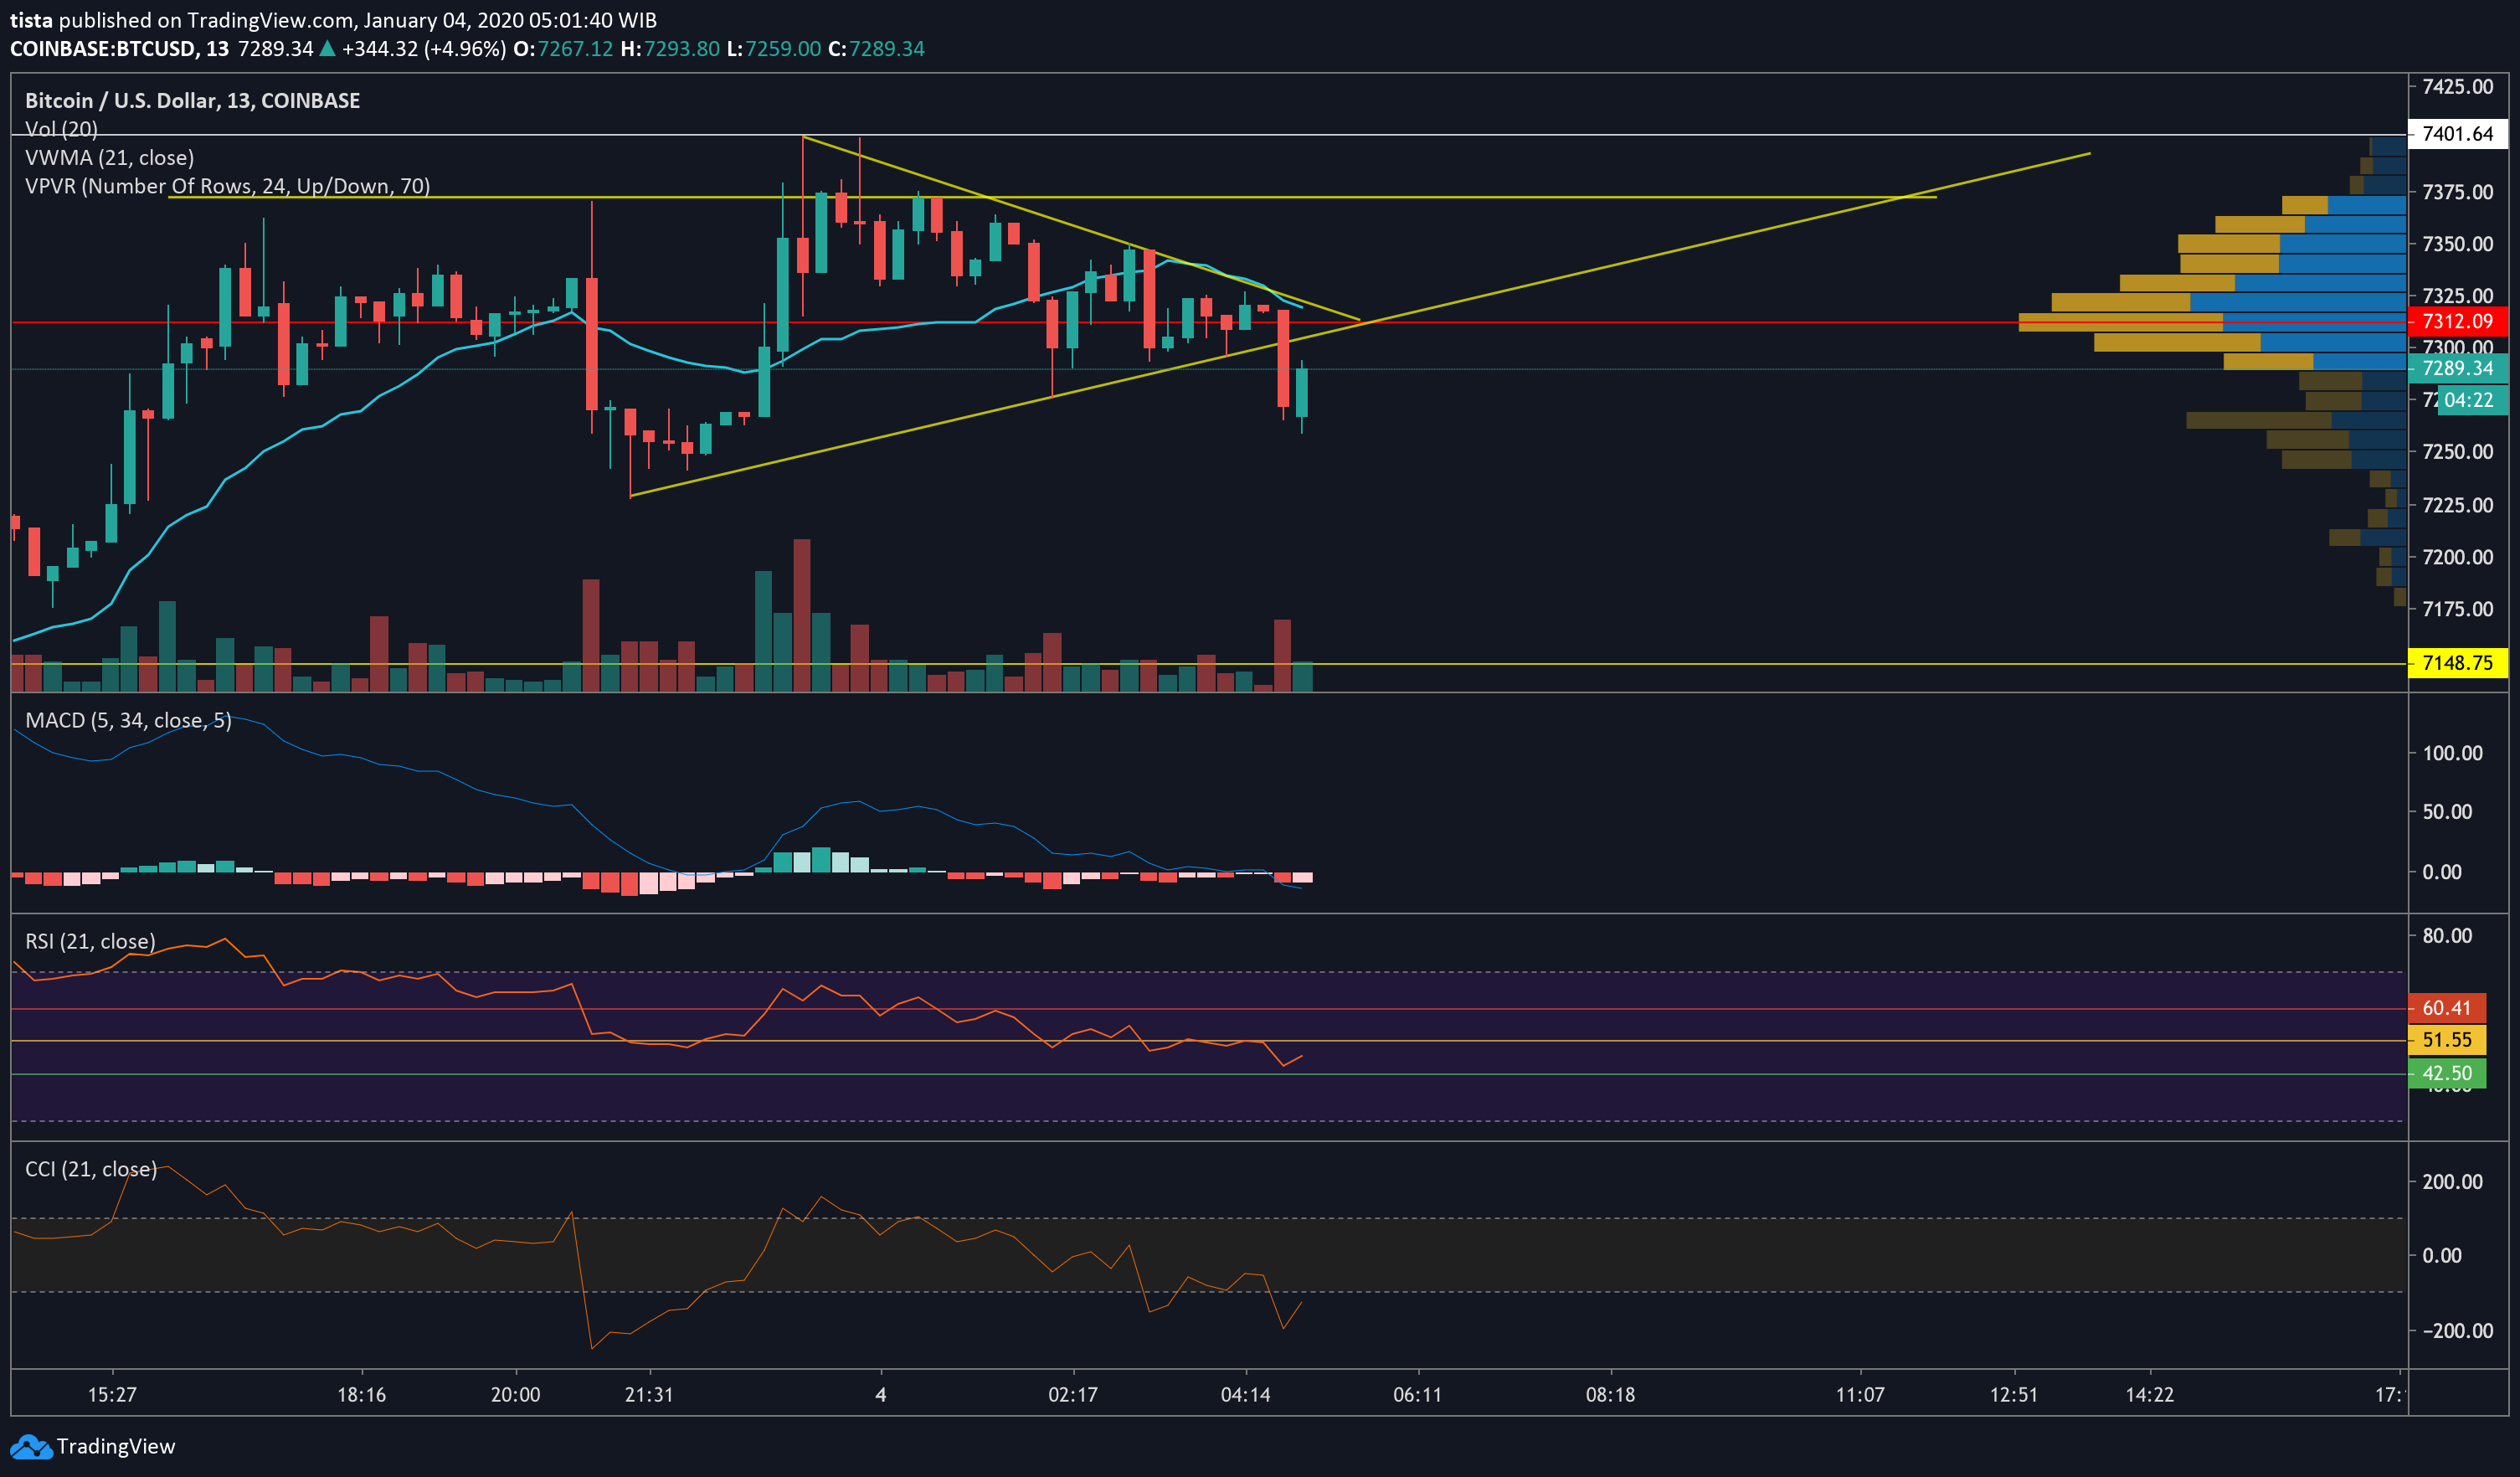
VWMA is the blue line, VWAP is the pink line and VPVR is the red line. The yellow is a trend line I drew from the daily timeframe. There’s a channel there between VWAP and VWMA. The upper limit which is the VWAP is just above the VPVR telling me that those 2 lines are very important. Price movement needs to break those levels to mean anything. VWMA is acting as support here, if it breaks VWMA and the yellow trend line then prices have a tendency to go down.
Further more, the volume is getting lower and lower as time goes. Usually it’s time for a breakout.
Oscillators
There are 2 oscillators I use:
- Relative Strength Index (RSI) with 21 as its length
- Commodity Channel Index (CCI) with 21 as its length
I’m not gonna go into details with those 2 indicators. The indicators are there to help spot divergences. For each indicator, I also have lines drawn. Based on reading of the chart, when those lines are broken, prices move according to the trend.
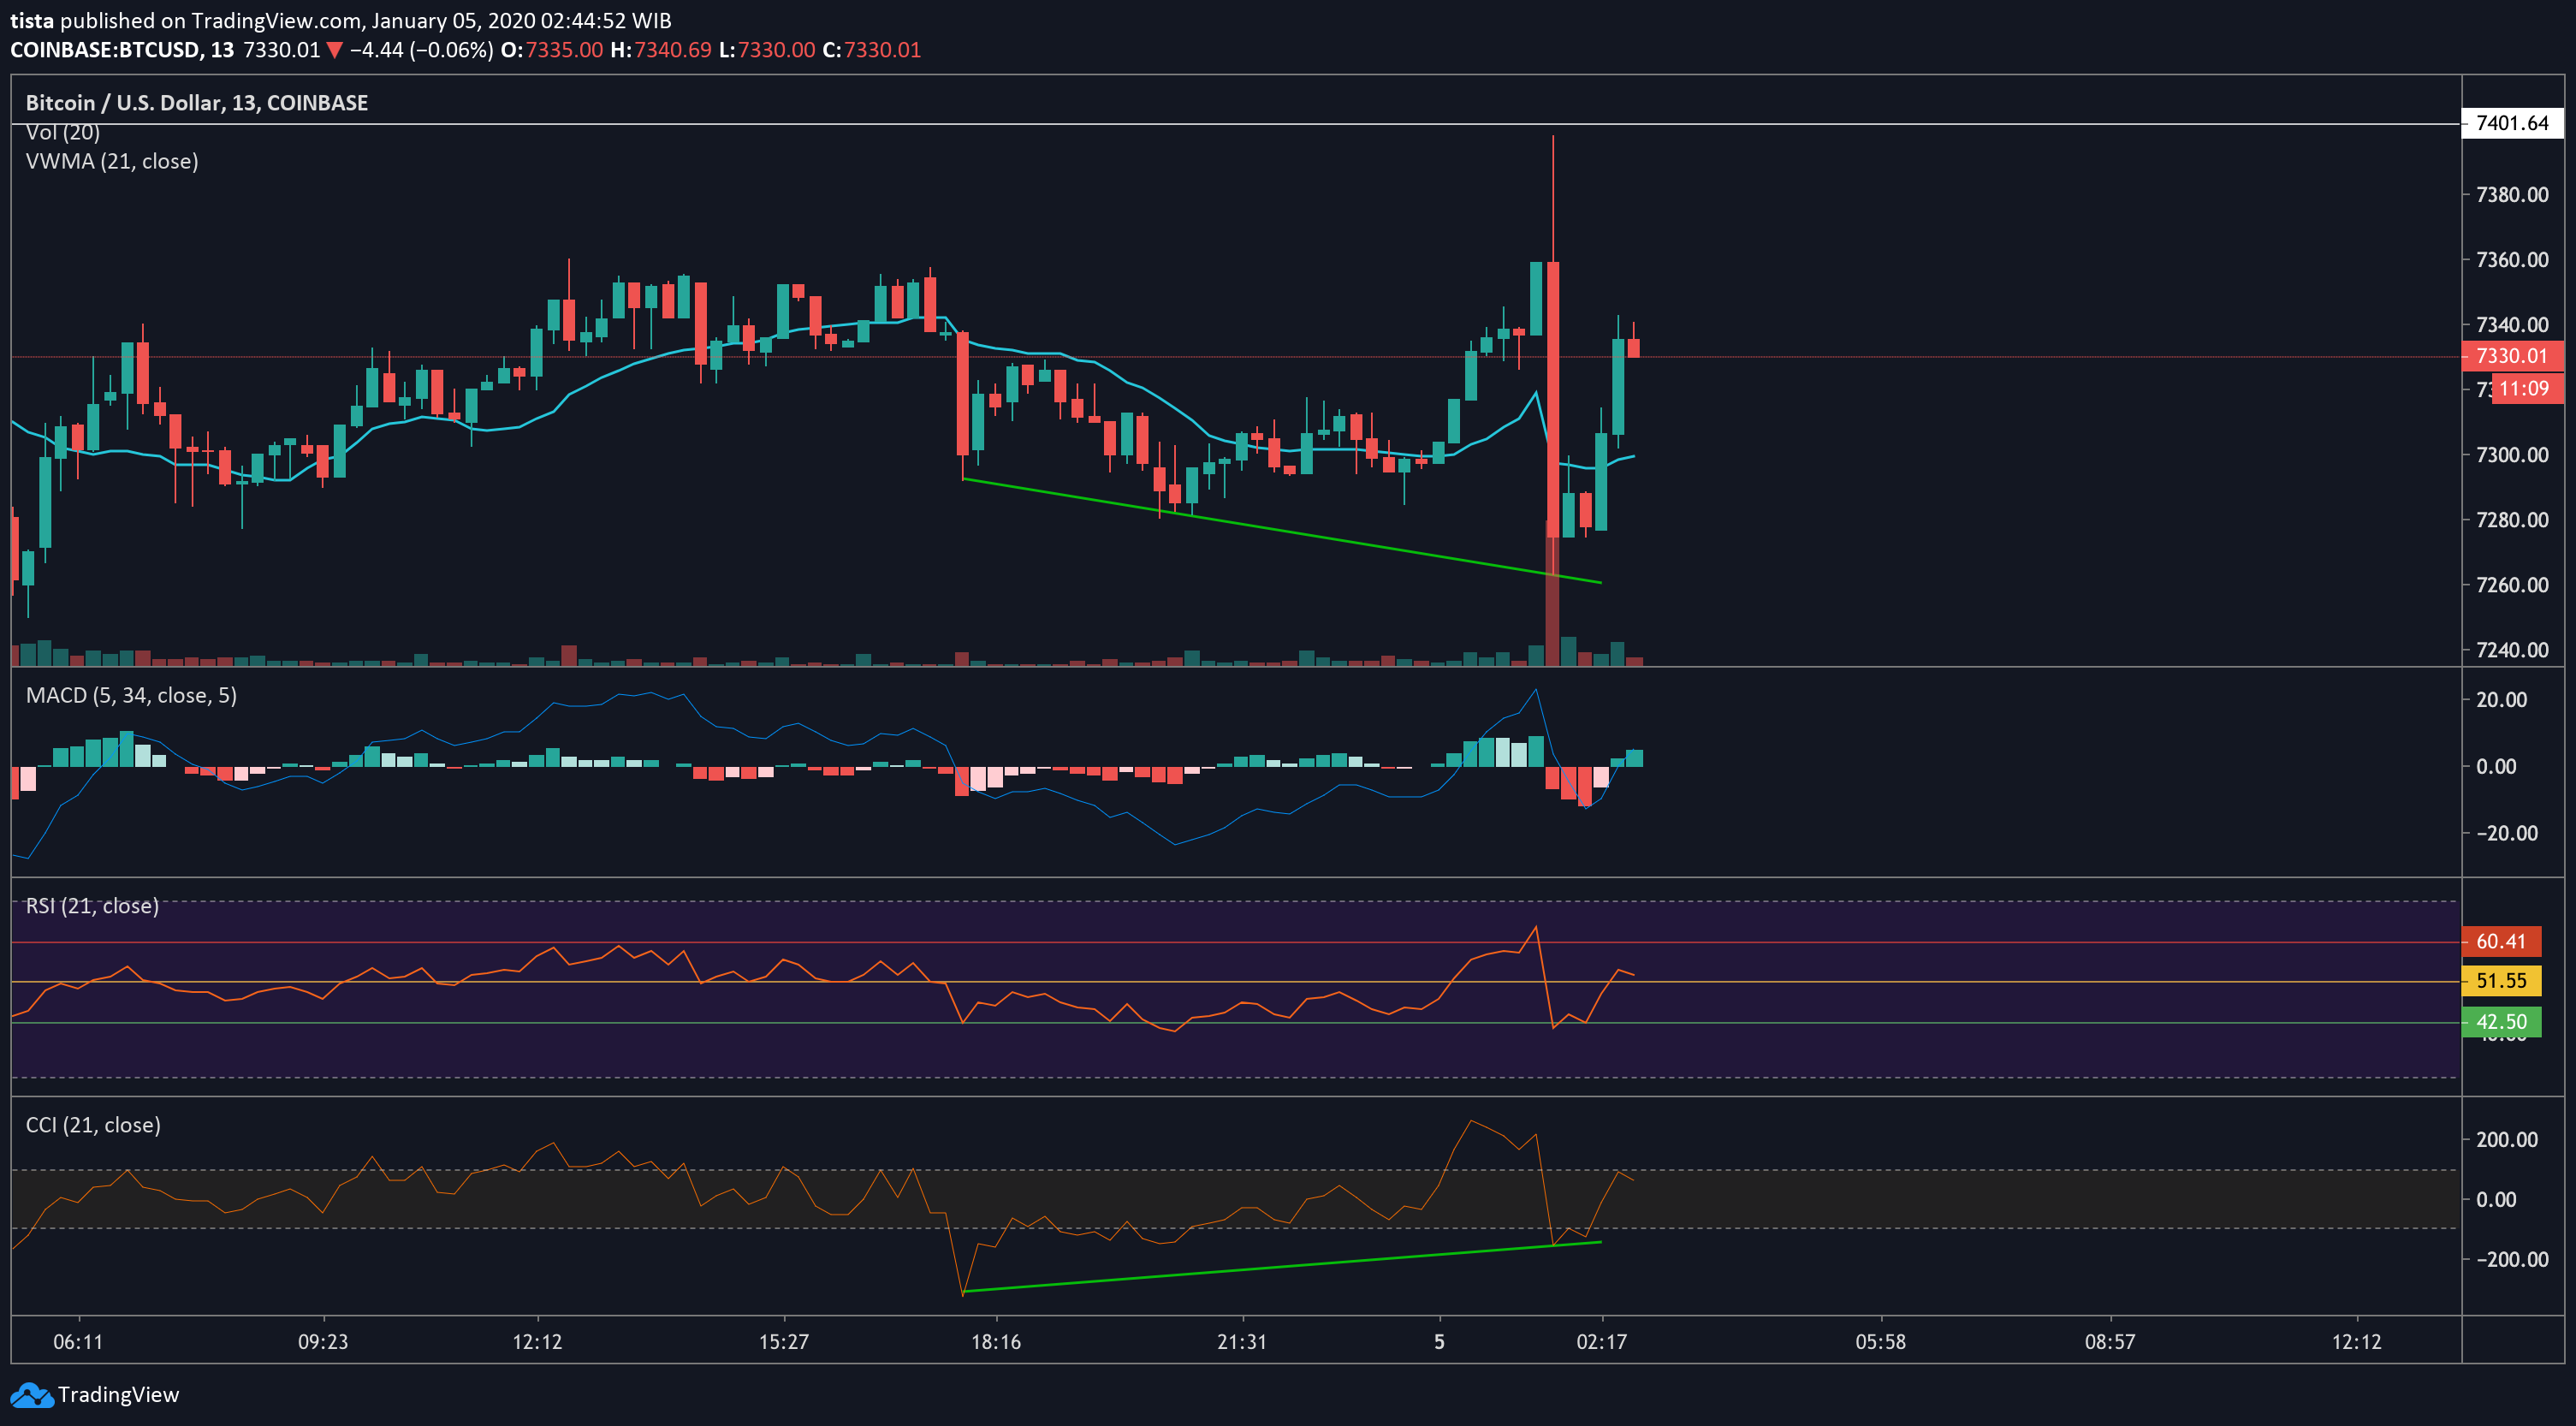
Looking at the chart above, there’s a massive bullish divergence on CCI hardly noticed by RSI. Both helps to notice divergences.
Screens
I have two 24” 4k screens that I use to trade and do work. Both as a trader and software engineer it gets the job done. But my wishlist include upgrading these screens to wider 49” screens I can stack vertically. With the screens I have now, I can only focus to 1 chart at a time. I want to be able to focus to multiple charts with multiple timeframes.
I think the rule of thumb is to use more than 1 screen so you don’t have to go back and forth between your chart and trading station.
Hopefully there’s a 4k ultra wide screen, my eyes are already used to 4k.
Internet Connection
As far as I can remember, I always want fast Internet. The more bandwidth I have, the faster I get shit done. Where I live, I think I’m part of the 0.1% in Indonesia with a 150 Mbps connection at home. The latency can be better with or without VPN but it’s enough to my needs.
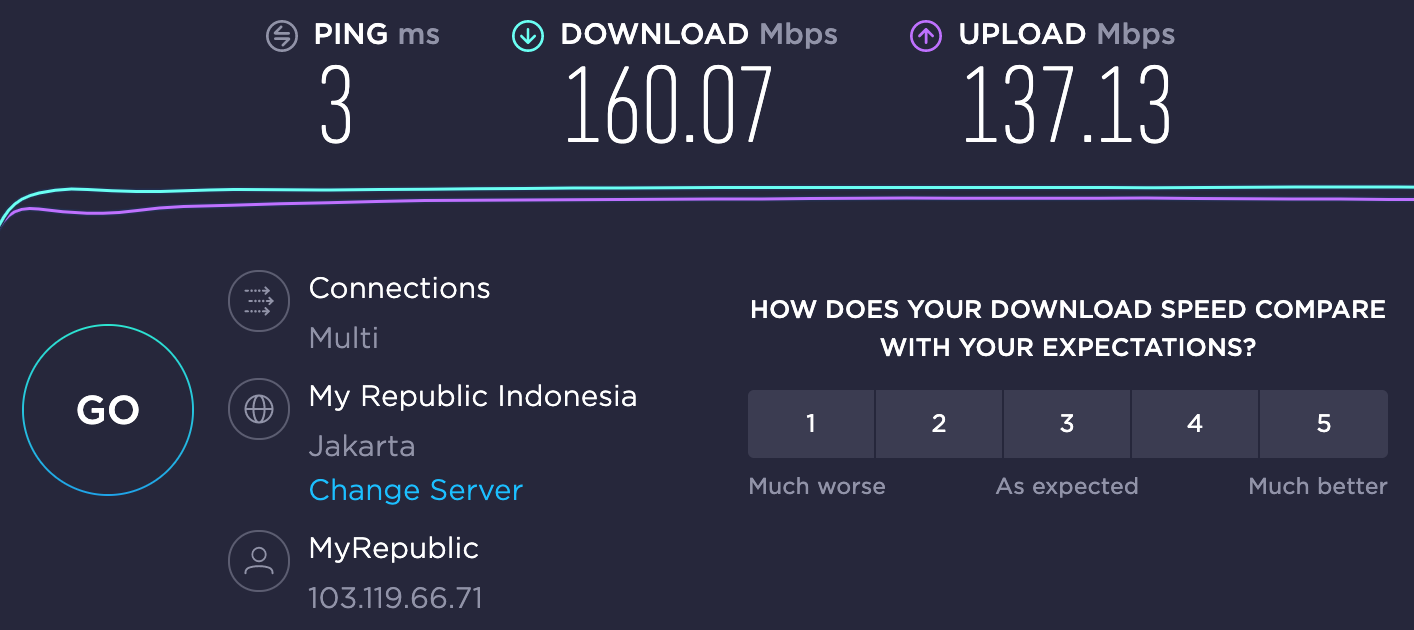
Other than trading or coding, the Internet is used for Manchester United matches, Netflix, Youtube and other fun stuffs. I don’t want my leisure interrupt my trading, vice versa. I make a living from the Internet, $50 per month for the connection is fair play.
Exchange
I use Bybit exclusively now. Register from my link and we both get bonuses from Bybit. I used to use Bitmex but Bybit’s interface won me over. Everything is snappy and when there’s a pump or dump, the interface does not lock up. I hardly come across errors when putting orders through, unlike Bitmex.
Bybit also shows your P&L in USD, for me this helps a lot in picturing how much I gained or lost. Other than that, their Closed P&L tab is helpful in evaluating your trading performance. I keep screenshots of my trades as materials to learn afterwards. Bybit helps me evaluate by having a clear history of my P&L.
That’s a wrap for this blog post. I hope this helps you. Cheers!