If you trade cryptocurrencies, you’re usually booked for destination fucked for your first trade. I’m actually talking about me. Cryptocurrencies were my first trading experience, never before I traded. In this blog post, I’ll be writing about what I learned so far from a technical analysis point of view.
Over the years I’ve written and co-written trading bots with friends. I can categorically put the trading bots into 3 categories:
- Arbitrage
- Technical Analysis
- Market Making - Not writing about this today, too complex, deserves its own post
Arbitrage
The BEST performing is hands down arbitrage. Back in the 2017 Bitcoin bull run, the arbitrage bot written by an engineer friend got supercharged by other 20 engineers. Collectively I would say our highest income collectively was around US$ 35k per day. Personally I put in US$1000 as the capital and everyday I would be in the US$300-700 range depending on volume.
If you’re on an exchange where arbitrage is possible, take advantage of it. Markets are inefficient, there will always be prices differences. We managed to collect huge sums because the Bitcoin price in Indonesia was inflated by as high as US$22k while if you check Coinbase, Bitcoin’s all time high was US$19k.
The exchange we used offers IDR and BTC markets. We traded in the biggest Indonesian exchange: Indodax.
Another lesson when doing arbitrage is that the codes and the physical distance between your codes and the exchange’s must be as fast and as close as possible. Your latency must be below 10 ms, this means from receiving responses to executing orders must be done in that timeframe.
The codes started as plain old Python that our friend wrote. It was the most money making spaghetti code I’ve ever read and modified. But since it was Python, everyone can pitch in. My contribution was optimizing the code to be compiled with Cython and parallelizing whatever part of the codes that was possible.
If I had to do it again, I would still choose Python but taking into consideration Cython’s way of running fast. Since Python 3 comes with type hints, I’m sure we can do well. However, handling streams instead of polls would be convenient. If NodeJS + RxJS can be as blazing fast, I might switch but it’s still a long way. I tried RxPy, it was a nightmare. Just like security, convenience is a trade off I can live with.
Technical Analysis
IMHO if you wanna code trading bots with TA, you must learn to be a trader first. It’s true that we poll or request push updates from an API but you need to understand the rationale of indicators and chart patterns to effectively code a performant bot.
Of all the bots I tried to code, this is by far has the most potential to get you to give charity to the market. Indicators are mostly some form of normalized numbers coming from formulas that doesn’t understand the psychology of the market. Instead of looking into just price/volume movements, we can do well understanding the structure of the market.
The book Trading Chaos by Bill Williams taught me about understanding market structures. Although the book is old, it’s still relevant. The first few chapters of the book doesn’t talk about anything technical, only talks about correcting how you see the market.
“Fate is fluid, destiny is in the hands of men” - Tagomi-san from The Man In The High Castle
Fluid as in an indicator can bottom out at 0 for a few candles with prices going down hard as brick. If you’ve ever traded before, you’d know which indicator I meant.
However, indicators when matched with a correct understanding of market structures is the dream. Since we humans are inefficient beings, we won’t be able to have perfect entries. As long as the wins are more than the not-wins, we’re good. Here’s a Youtube video that complements what Bill Williams talk about the psychology and structure of the market.
Market Phases
I promise you it’s not clickbait. After watching that video, I’m sure you will see charts with a different mindset.
That red box on the chart is drawn from the lessons I learned from the video. There are 3 phases for every market wave:
- Contraction
- Expansion
- Profit
The video explains these very vividly with live trading examples. I won’t try to explain it, the author did a very good job.
In connection with what Bill Williams taught, we would do well to draw Elliot Waves in correlation with the boxes. Draw the Elliot Wave on a larger timeframe, I think 6H is the minimum. This will give us a better understanding of the current state of the market and which direction it’s going. If we catch wave C then prepare for a shitload of profit (not a financial advise).
I’m a scalper, I draw my boxes in the 15m timeframe. If I have doubts, I would check larger timeframes, 1H and 4H being the usual.
Indicators
The indicators comes from TradingView scripts I wrote and adapted, find it here. Since I’m a scalper, I trade with the trend and sometimes only price movements. I use indicators to help me find divergences which signal reversals. Of all the oscillators I’ve tried, I think Bill Williams' Awesome Oscillator is the most accurate in signaling reversals.
I try to keep as few indicators I can in my charts, only using the indicators for the purpose of my trades which is mostly scalping. I rarely have an open position for more than 3 hours. If it’s more than that than I usually identified the wrong market phase. Being human, you can’t keep emotions out 100%, just have to accept the not-wins and move on.
This next statement I feel will ring true for any situation: volume is key. Use indicators factoring volumes into its formula. If you wanna spot fake outs, check the 1m timeframe (true for Bitcoin).
If prices go up or down with a relatively far distance with volumes below the volume moving average, usually those are fake outs. Also watch for how the candle tells you a story. Doji candles tells a lot, check here.
Support and Resistance
Now for me this is the hardest part of my learnings. Support and resistance is the most difficult concept to comprehend for me. The market is inefficient but why does certain price levels act as a magnet for prices?
Fibonacci
The first time I really acknowledge this is when I was tasked to do an algorithm to produce the sequence in college. Yeah I read about Fibonacci numbers are everywhere in nature but I never really understood what it means.
Fractals
Again I talk about Bill William, this time about Fractals. Since we humans are part of nature, we follow a sequence of numbers called Fibonacci Numbers.
An example of the sequence: 1, 1, 2, 3, 5, 8, 13, 21, 34, 55, 89, ....
Transforming the sequence with a formula of Fn = (n + 1) / n will result in a number closer and closer to 1.618 or the golden ratio. What is the golden ratio? It’s a ratio found in anything of nature. There’s a webpage here that talks about this in a fun and amusing way.
As an example, I measured my middle finger (longest) at 10.5 cm and my thumb (shortest) at 6.5 cm, when I divide them, I got 1.615 which is pretty damn near to the golden ratio. My middle finger is exactly the extension of my thumb by 1.615x.
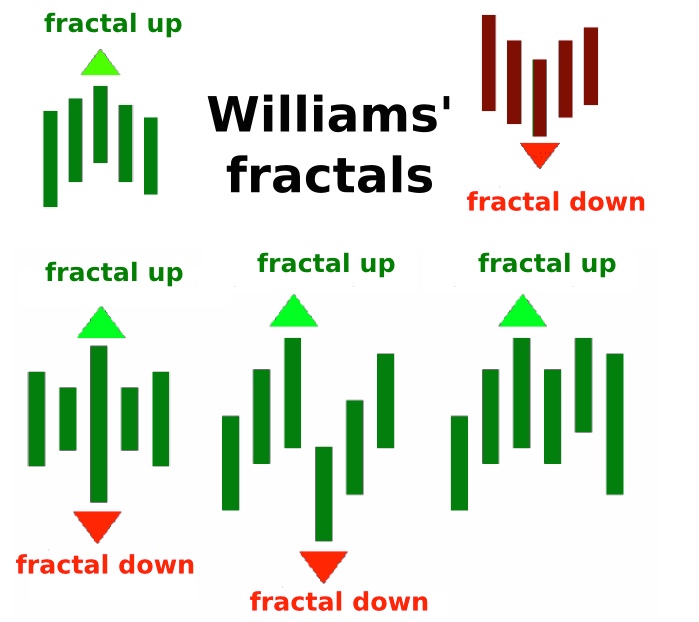
If you look at the first row’s fractals, looks like our hands right?
Fibonacci Retracement
The above would remind you about Fibonacci retracements I think. Taking a high and a low only to find the 61.8% and 65% area is where prices tend to get supported or rejected, it’s called the golden pocket. When zooming out to find another high with the same low, we could find confluence of the previous area in relation the retracement levels.
Things to see:
- On the first retracement, prices got supported exactly at the golden pocket.
- On the second retracement we see prices got supported and rejected in the golden pocket.
- The first retracement at
50%level and the second retracement at the golden pocket is a confluence level for the two retracements. - The second retracement’s
1.618ratio or161.8%level is more or less the bottom of the first retracement. Another area of confluence.
The above is taken from a 1m timeframe. Retracements can be done in any timeframe and will likely produce the same things you see here. It’s not exact science for sure but then the market is inefficient, it’s made up of humans like us.
Oh and the Green and Red arrows on the chart are fractals. Highs and lows usually forms fractals.
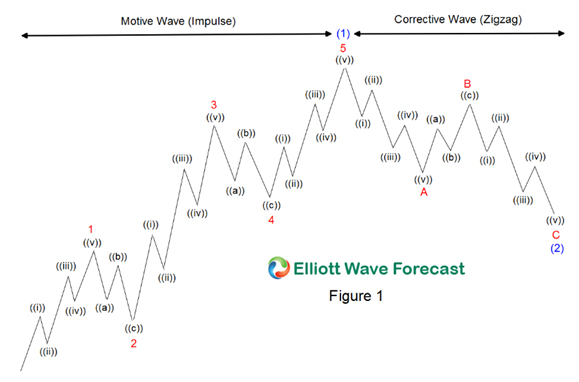
Elliot Wave
To be honest, my brother usually draws this. I just don’t have the patience and articulation to measure the waves. Elliot Waves are identified by calculating (again) the ratio of each wave’s highs and lows. Fractals and Fibonacci retracements being the building blocks. I won’t try to be smart with this and just link you to a webpage which I think explains it the best, here.
I’m usually interested only on Wave C since it’s the longest wave. However, when margin trading with Elliot Wave as the pattern, it’s wise to keep the leverage low. In each wave of a higher timeframe, you can draw and find complete 12345ABC waves on a lower timeframe. Prices can go up and down drastically sometimes forming a long doji with a thin body indicating manipulation (*cough).
Knowing all of the above, can we write codes to produce a trading bot to act based on the knowledge above? I haven’t tried. I had more fun trading using the knowledge, haven’t written any codes for it, yet.
The most fundamental lesson I learn is that nothing is linear in nature. I usually avoid oscillators with a fixed range. When on trend, prices can move up and down drastically while the oscillator stays at either its minimum or max value. It’s deceiving and I only use them to spot divergences.
To wrap up this blog post, I think my biggest learning comes from unlearning what I know before. It’s like how an engineer who usually do Object Oriented Programming gets thrown into Funcational Reactive Programming. I needed to rewire how I see the market. The new perspective helped me find structure not just patterns.
Last but not least, don’t do any paper trading. As do with anything in life, need to fail faster, by failing I means loosing money. It gives you the right amount of anguish to motivate yourself to learn from it. Don’t trade your kid’s lunch money, use your own fuck you money.