
Anyone who trades using Technical Analysis knows what indicators are for sure. There are plenty of them available. As trading is becoming more serious instead of a hobby for me, I have an itch I need to scratch. I want to easily determine when to long or short given a set of indicators using predetermined (naive) assumptions of values.
Indicators
Here’s a set of indicators I use for a strategy. I started with these indicators to write my Bayes Oscillator.
Moving Average
Take for example a Moving Average (MA).
If the force or momentum of price movements tries to break up of the blue line (MA) and succeeds, it’s likelier the next candles would be bullish. This example uses an MA200 line. In short, we can make an assumption in the event of prices breaking up above MA200 then it’s bullish.
Bollinger Band
Let’s use another indicator Bollinger Band (BB).
Looking from the example above, we can see if prices breaks up from the upper band, it’s likely for prices to come down. In short, we can make an assumption in the event of prices break up the upper band then get ready for a correction.
Naive Bayes Classification
Sometime ago (very long ago), one of my tinkering project was to do a spam or ham classification type app to filter news I’d wanna read from DailySocial. So I built myself a Naive Bayes Classifier to feed me my relevant articles. It worked great, I can cut through the noise.
The hassle was I needed to manually train it to understand what I wanna read. I trained it using 50 articles and to my surprise, it’s enough.
Complexity Theory (Chaos?)
I’ve been reading a book called The Road to Ruin by Jim Rickards. He described how he got to his conclusion of how the stock market works by using Complexity Theory. Bill Williams would agree. Jim tells us that by using just enough data, we calculate the probability of an event to occur. We can’t say for sure when but we know it’s coming. This was my light bulb moment.
While Jim talks much about Bayesian Inference in which a probability of an event can always be updated as more evidence comes to light, I had my eyes set on a binary probability of when prices are going up and down.
Assumptions
These are my assumptions:
- Prices breaking up a Bollinger basis line will have fuel to go up even higher
- Prices will go down when prices have broken up a Bollinger upper band
- Scalping is the main method so we should use a lower period Moving Average (MA)
- When prices are above MA, it’s likelier a correction to the downside is imminent
- When prices are below MA, it’s likelier a correction to the upside is imminent
- Optimize parameters for 1 hour timeframe which will give us time to react while still having more opportunities to trade
Building Blocks
Jim Rickards started with limited data (events) while in technical trading, data are plentiful. I decided to classify 2 events which are:
- Next candles would be breaking up
- Next candles would be breaking down
Key facts:
- We won’t know for sure when prices are going to break
- We won’t know for sure how much the prices movements are going to be
Formula
The long and descriptive explanation can be read in Wikipedia here.
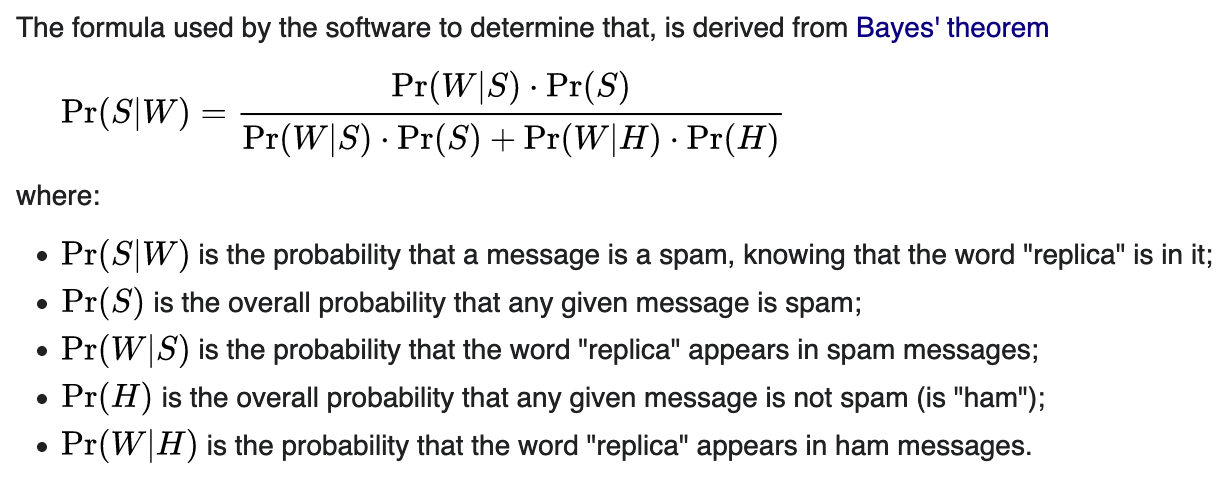
Given the formula above, what we need to do is to substitute the events to our assumptions.
Next Candles Breaking Up
The formula becomes:
| |
Next Candles Breaking Up
| |
Lookback Period
In order for us to be able to calculate probabilities, we need indicator values from past events. I call this the Bayes Lookback Period where probabilities are based on events that are happening for x number of candles before the current candle.
Indicators With Multiple Values
To keep things simple, if an indicator such as Bollinger Band produces more than 1 value, let’s treat each value as a single event. Later when we have all the probabilities, we will combine them.
Combining Individual Probabilities
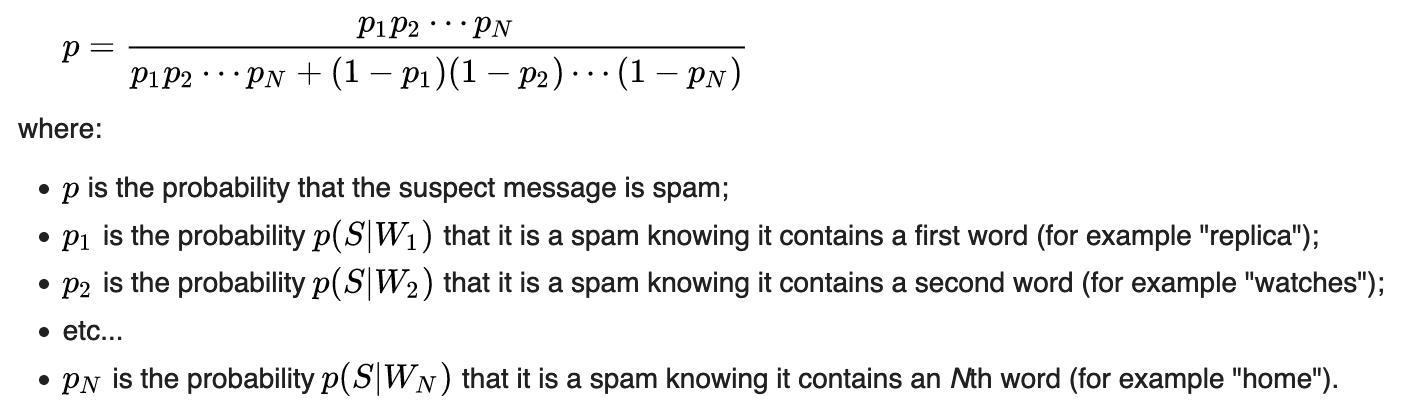
The above is the formula used by Paul Graham on his 2002 article.
The Result
This is how to read the oscillator:
- Green is the probability of prices breaking up
- Red is the probability of prices breaking down
- When either green or red is flatlining ceiling, immediately on the next candle when the probability decreases go short or long based on which direction you’re observing - Strong Signal
- When either green or red is flatlining ceiling, take no action while it’s ceiled
- Usually when either green or red is flatlining bottom, the next candle when the probability increases, immediately take a short long position based on the direction you’re observing - Weak Signal
- When either green or red is flatlining bottom, take no action while it’s bottomed
The results are surprisingly VERY GOOD! I’m taking this one step further and I wrote a backtest program in Tradingview.
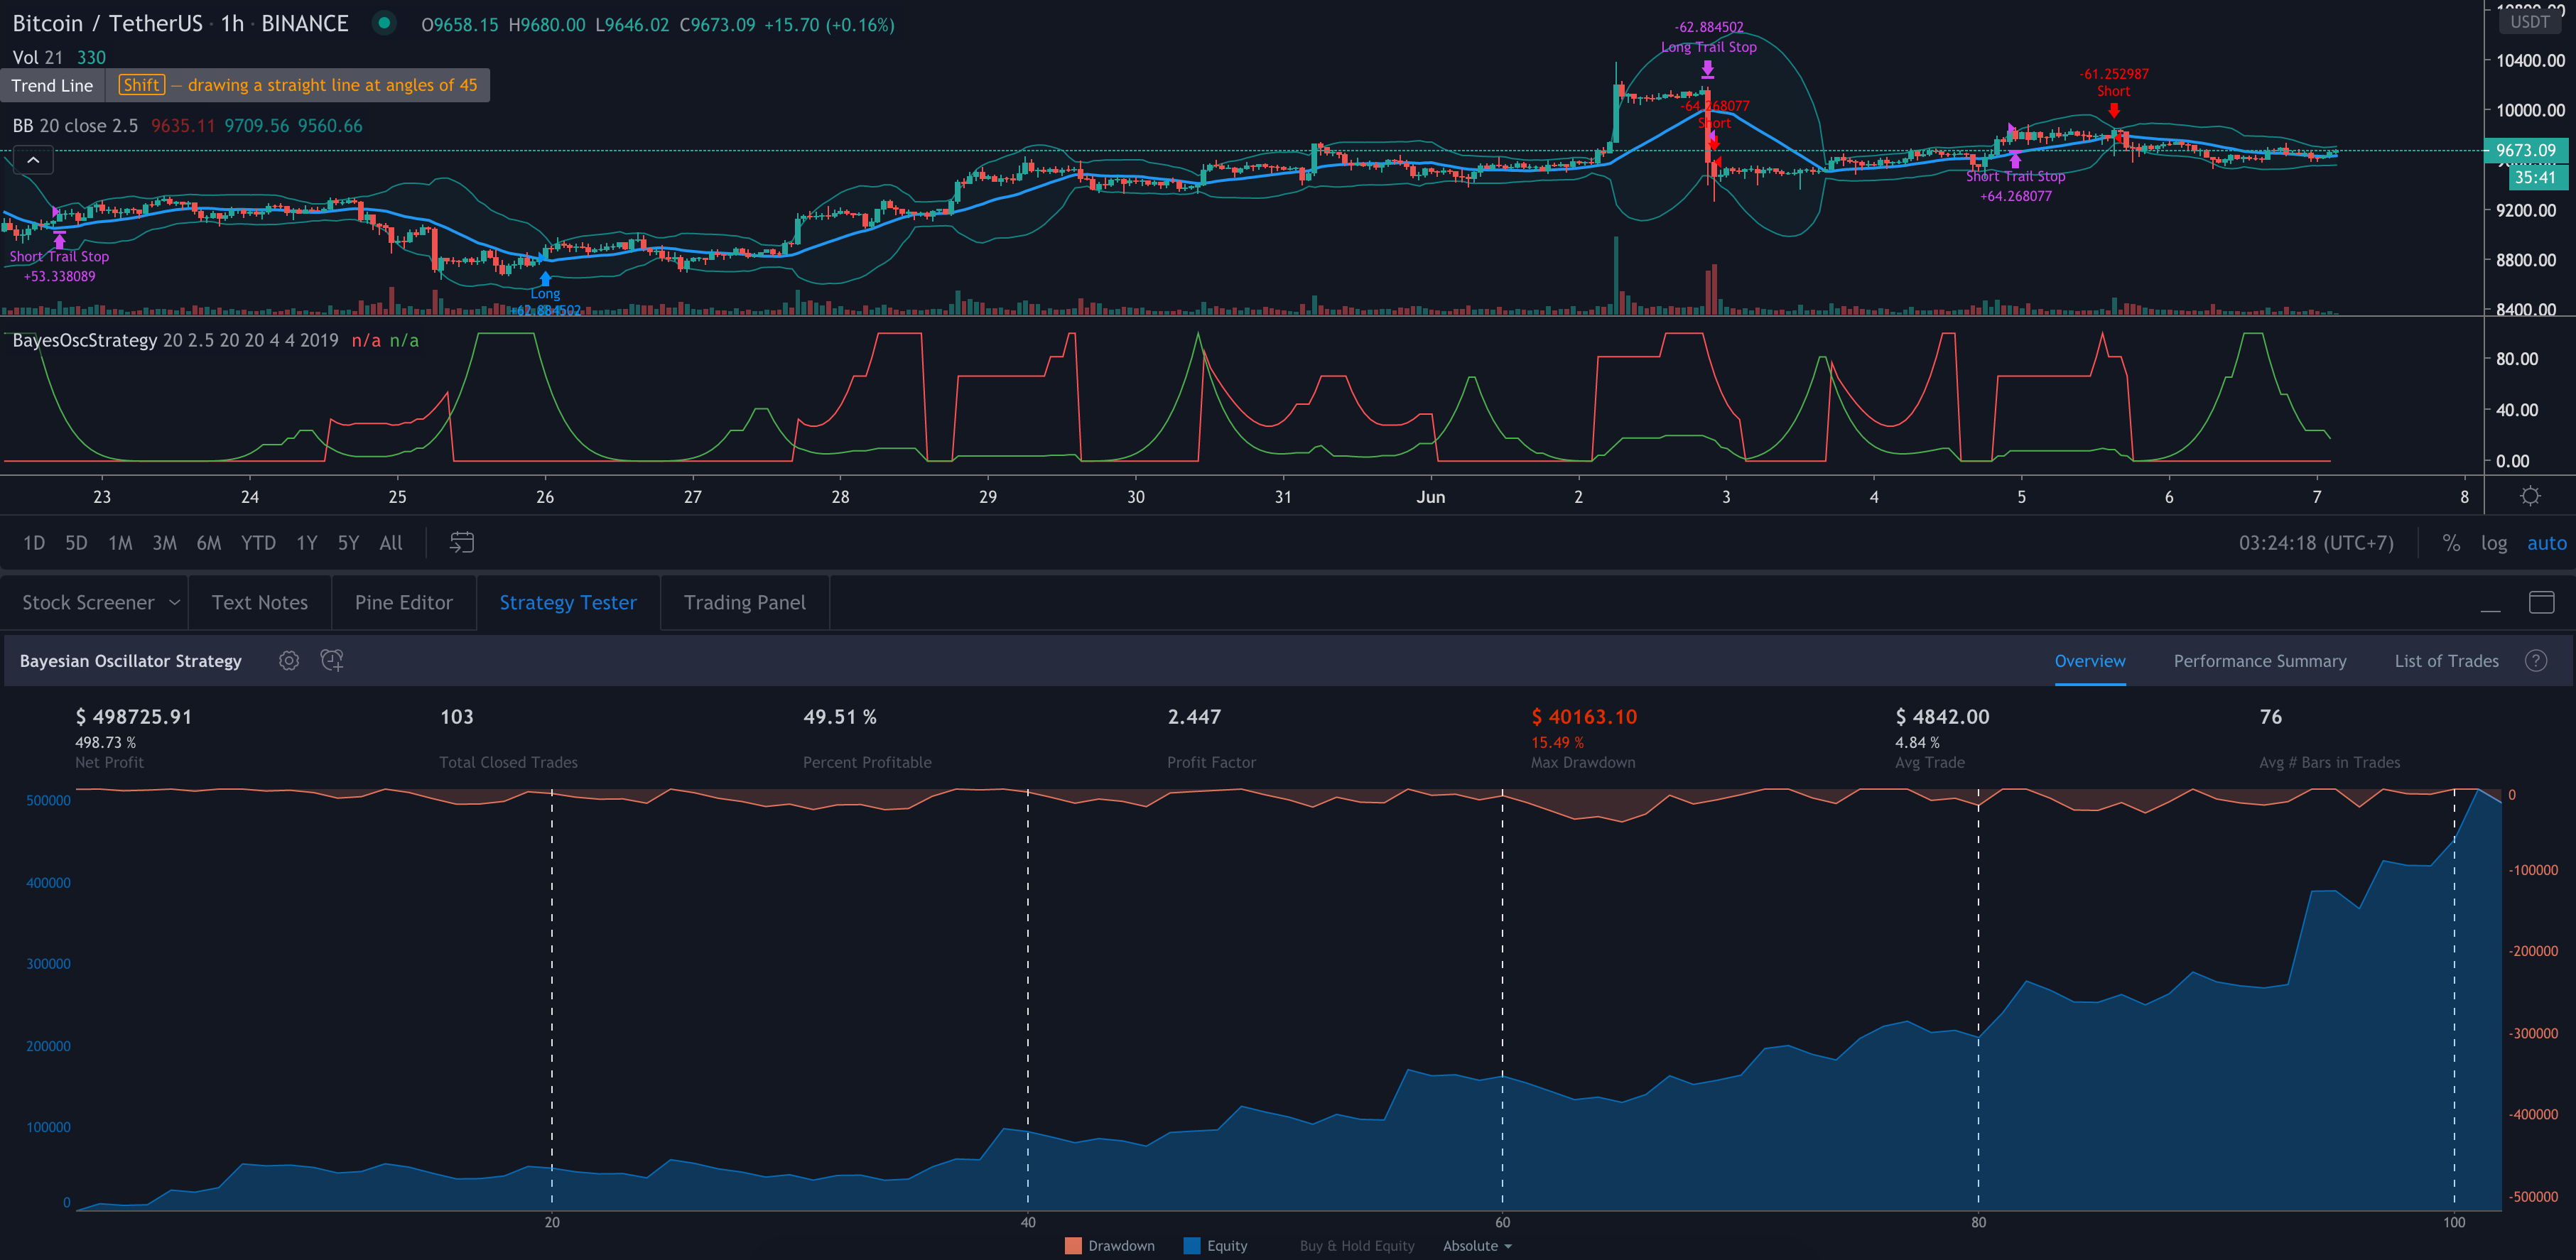
The backtest calculates both shorts and longs with 1x margin. The yield from 2019 is 498.73%, this is almost 6x.
To wrap things up, this is a simple solution for a complex problem. Doesn’t take much computing power at all. My next plan would be to generate alerts from the indicator and start trading with it. Just took a long position a few hours before I wrote this blog post.
Let’s discuss! Click below and mention me on Twitter.
UPDATE: both the indicator and the strategy are published here.