This is the second round of Bill Williams for me. This time it sticks and I built a system out of it. This is after paying a hefty tuition fee (losses), no more. As do with anything in life, the usual solution for complex problems is likely simple albeit far from easy.
How It Usually Starts
As I said here, the most difficult concept for me to comprehend initially is Support & Resistance. This is likely the first thing anyone learned. I understood it eventually by understanding Fractals.
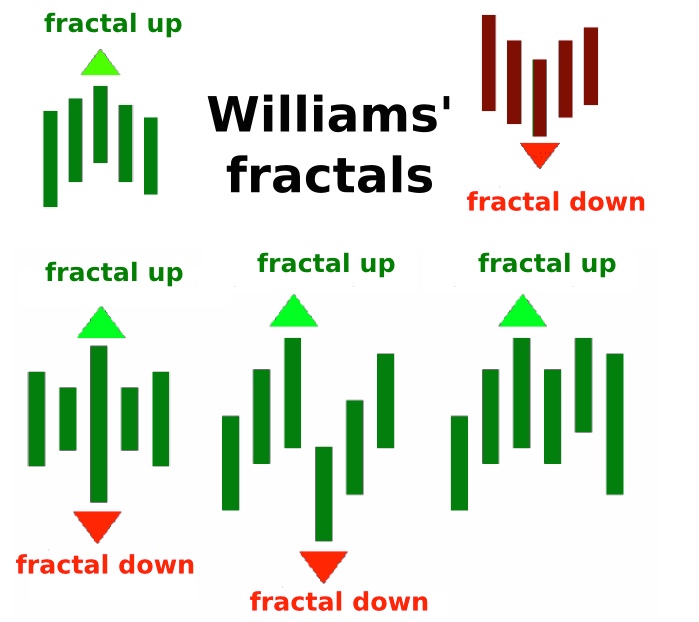
Fractals are magnets for prices, prices usually are attracted to touch them and stick around. This led to another tool called Fibonacci Retracement.
From here on, to each his own. The most used indicator of all would likely be RSI, Stochastic RSI, MACD, etc. As there is no sure way to know when or how far prices will go up or down, belief system became prevalent in determining the next learning cycle, this is what happened to me at least.
Belief System
I code my first time while I was early in childhood. Coding was an itch I wanted to scratch, the itch keeps getting itchier so I learned more and more as I grew up. While most teenagers would spend time hanging out, I spent mine learning how the Internet works. Especially during my Junior to Senior High Schools, I always afforded myself the time learn about codes.
Coding is based on deterministic foundations, binary signals running through a device’s vein. Only recently with the advancements of CPU’s and later GPU’s, AI is becoming mainstream. Nowadays it’s ok not to be correct 100% of the time by being deterministic. I wished I had known this sooner.
In Technical Analysis, indicators are the bread and butter and as such people way smarter than me researched how prices move. Trying to quantify or even normalize something that is not certain. I would characterize this like trying to measure an island’s edges by using straight lines. Nothing in nature is perfect. That’s what I tried to do before embracing chaos. As it turns out, I was limiting myself. To make matters worse, I did it with lower time-frames, this meant high risks and inconsistent returns.
Nobody is convinced they will lose a trade in the short or longer term when they open one, I read this on Bill Williams’ Trading Chaos book. Looking at charts will always result in fortifying whatever bias you’re in, then why are 90% of people are losing money? This included me.
How do you win a chess game or a poker match? It’s always about understanding the psychology of the opponent for me. Sure there are technical involved like how a knight move in chess or the number of cards you’re dealt in poker. Everyone who plays understands this.
I once played poker with my brother and friends, my brother used a mask printed with a Joker’s smile, he did that to influence the game which is other people. He helped me understood other people’s tells and the game ended with both of us as the last players standing. So why is trading any different? It’s a bunch of people risking their money for more money.
When I started creating or recreating an indicator I published, I do it either to hack an indicator so it worked better for me or to understand the market better when breakouts happen.
Using Bayesian Probability worked very well. More often than not, Bayesian Probability will be able to predict an outcome of an event in the future by having very little data initially. The cool part is when we put naive understandings. Like when prices closed above a Bollinger Band’s upper or bottom, it’s likely a winner if the next candle closes above it. TradingView put the indicator into the “Best Scripts Of The Month” category, was impressed by myself at the first try. Try it here.
With the indicator above, I find myself back again to Bill Williams territory. The more I understand the people behind the facade, the more profitable I became. I had more itches to scratch. I needed to go back to the roots of chaos and learn more about what I did wrong the first time around. I had to rewire how my brain perceives the people behind the market.
Fundamentals
I’ve seen more than once how fundamentals changes how prices move. Regardless of it being manipulated or not, the illusion of it is enough (paired with volume on the chart) to invite people into losing money or winning dramatically. So I studied on this more before starting on something new. I needed to learn how money works in the world.
Coincidentally I got myself a reference to Jim Rickard’s Road to Ruin book. I was dumbfounded by this book. Jim Rickards targeted people like me who didn’t know how money works and boy did I learn much from the book. I was not impressed at all by what I learned. I bought gold because of what I learned to hedge against the world’s economy. Gold is money.
I won’t steal your thunder, if like me you want to learn about how money works and how to preserve it, you should read the book yourself.
Leverage
From what I can understand after more research, the money making party of the stock market ended years ago. As you can see for yourselves, volatility is gone. To counter this, leverage is introduced. You can have $1000 and trade as if it’s $100,000. Heck if you’re trading in Forex, you can have as much as $1,000,000 in leverage from your $1000. Rule of thumb is less volatility equals more leverage.
Leverage from my point of view is a necessary evil for all parties. It attracts new blood (new liquidity) and therefore mosquitoes too. I want to be a mosquito now, my blood was drained but I still have more left. It’s time to be the winning 10%.
Smart Money
The best advise I listened to was: “Follow the smart money”.
Forget everything I’ve learned thus far initially and see how smart money moves. Let me show you on a tweet how Bitcoin moves.
#BINANCE manipulation i don't believe in coincidences pic.twitter.com/0ElamgMX6I
— Crypto Japan (@SirbuOffice) June 30, 2020
Just after Binance upgraded their platform, soon after other exchanges follow suit. Even my local exchange in Indonesia did an upgrade.
So now I got my knowledge and information collected, I need to learn how to act on them.
Bill Williams Breakout Setup
I have referred to the man multiple times whether tweeting about him or writing a blog post. Now I want to relearn how breakout trading works, again. A while ago, my friend Patris invited a bunch of us into a Zoom conference sharing us how his setup works for him. He reintroduced me to Bill Williams’ indicators which looked like below.
The rules are simple:
- Prices are moving away from Alligator, open and closed above the first time.
- AC is twice consecutively at par with the direction.
- AO is twice consecutively at par with the direction.
- Entry on the third candle to be sure, or the second if you’re willing to risk it.
The chart above is an example from the 4 hourly time-frame. Before going into any entry, to get a macro perspective, should check on these time-frames first:
- Weekly
- 3 Days
- Daily
Bonus points if monthly time-frame is also at par with the bias. Here are the charts for the larger time-frame.
As you can see above, the larger time-frame are all on a bearish bias on Bitcoin. It’s going to hell before any significant move up is going to happen. CZ and co have been printing money out of thin air with Tether, it’s time for them to cash out. But I think Bitcoin will survive, with a relatively low volume compared to precious metals, it’s only logical to keep playing with the market, volatility will always attract new blood.
Bill Williams Oscillators
It’s been profitable trading with the above setup but then I have an itch to scratch. I wanted to have just a single oscillator instead of two to look at. It will enable me to make decisions faster and can use my brain juice to think about something else.
So I combined the two to create a new oscillator. I call it the Milan Oscillator in honor of my friend Patris who reintroduced me to Bill Williams again. Patris’ favorite team is AC Milan, here’s to you bro 🍺
Here are the same charts above with Milan Oscillator.
The same rules apply as the rules above only now I only have to look at 1 instead of 2 oscillators.
Find it here to give it a try.
Bill Williams breakout trading setup is the most profitable system for me. The reasoning behind it to understand the psychology of the market tunes well with me. The oscillator I created can be used for both swing or scalp trades. I try to do both but most of my energy are spent on swing trades.
I learned from the community, I give back by always open sourcing and publishing the indicators I wrote. Mention me on Twitter, I need feedbacks, cheers!